Investment Help

If you are seeking investment help, look at the video here on my services. If you are seeking a different approach to managing your assets, you have landed at the right spot. I am a fee-only advisor registered in the State of Maryland, charge less than half the going rate for investment management, and seek to teach individuals how to manage their own assets using low-cost indexed exchange traded funds. Please call or email me if interested in further details. My website is at http://www.rwinvestmentstrategies.com. If you are new to investing, take a look at the "DIY Investor Newbie" posts here by typing "newbie" in the search box above to the left. These take you through the basics of what you need to know in getting started on doing your own investing.

Wednesday, June 13, 2012

Dimon Testifies on "The London Whale"

Today is likely to be a 3-ring circus as Jamie Dimon, JPMorgan CEO, testifies to Congress on the $2 billion losses incurred by the London trader known as "The Whale."

Dimon is another case of someone telling everyone else how to live and turning out to be a major sinner.  The bottom line is Dimon had weak risk controls in place and has made himself a poster child for a chops-licking Congress to skewer.

But there is another more important message, IMHO, for the individual investor to contemplate, emphasized by Dan Solin in "The Hidden Message in JP Morgan's $2-Billion Loss."  Consider that J.P. Morgan is one of the biggest trading entities in the world.  Bruno Michel Iksil, aka "The Whale," is obviously brilliant - you don't get to aggressively trade the size he traded at J.P. Morgan unless you are pretty smart.  He obviously had the very best resources including sophisticated value-at-risk models, the top graduates from the nation's business schools, etc., at his fingertips.  And still - he lost billions!

The message for individuals to contemplate is whether the fast-talking rep from the mutual fund provider/wealth manager promoting their stock picking/market timing skills can really do what they say they can do.  Dan Solin, author of The Smartest Money Book You'll Ever Read, says

The massive loss suffered by the bank is yet another indication of the inability of this huge institution (or anyone else) to predict the direction of the markets. Yet, the entire securities industry is premised on the false assumption that its members can add value by stock picking, market timing, and fund-manager picking.
He further points out:

The real skill of these "wealth managers" lies in their ability to convince you they have an expertise that doesn't exist. This latest debacle is one more example demonstrating the irrefutable fact that these investment gurus are emperors with no clothes, representing a significant, little-understood peril to your financial security.




Tuesday, June 12, 2012

Should You Wait on Social Security?

A perplexing problem for many retirees and near retirees is when to start receiving Social Security. There are a number of important dates:  begin at 62, full retirement age, have to start at least by 70. The longer you wait, the higher your payment - like most annuities - but if you die before you apply, you lose out.  The later consideration, of course, is why many just throw their hands up and take it at 62.

Others spend a lot of time trying to work out the brea-even point and then assess the odds that they will live past that point.

Here is another way to look at the problem, presented by Steven A. Sass of the Center for Retirement Research at Boston College - Should You Buy An Annuity From Social Security?

For comparative purposes, he presents the following table of inflation-protected annuity rates obtained from the Vanguard Annuity Calculator, January 2012.


AGE
MEN
WOMEN
COUPLES
62
4.5%
4.1%
3.4%
63
4.7
4.2
3.5
64
4.9
4.4
3.6
65
5.1
4.6
3.7
66
5.3
4.7
3.9
67
5.5
4.9
4.0
68
5.7
5.1
4.2
69
5.9
5.3
4.3

The table shows that men have a higher payout than women (because women live longer) and that the payout drops for an inflation-adjusted annuity that lasts until the second person dies.  As an example, the table shows that, if a 66-year-old male purchases a  $100,000 annuity, he can expect to receive $5,300/year, inflation adjusted for as long as he lives.

The annuity is an interesting option in that the payout rate is considerably higher than the safe withdrawal rate from the so-called retiree's "nest egg."  This safe withdrawal rate is typically found to be between 3% and 4.5%, depending on the study.  A huge negative in purchasing an annuity is that control of the funds is lost - for emergency purposes as well as for leaving an inheritance.  This gets balanced against the fear of running out of money.

Sass argues that delaying taking Social Security is equivalent to purchasing an annuity from Social Security and  is another option to consider.  He presents an example where a retiree would receive $12,000 at age 65 and $12,860 at age 66 if he delays for 1 year.  If he delays and takes $12,860 from savings to pay his bills, then the annuity rate would be $860 (additional lifetime inflation adjusted payment)/$12,860 (amount taken from savings)  = 6.7%.

Sass presents two important tables in his article, that show the increase in payment on a percentage basis for delaying at various ages as well as the annuity rates from delaying Social Security, the retiree can compare to safe withdrawal rates and annuity rates offered by insurance companies.  He concludes "...buying an annuity from Social Security, especially in today's low interest rate environment, is the best deal in town."

Disclosure:  The information presented here is for informational purposes.  No recommendation is made.  Individuals should consult with a professional or do their own research before making financial decisions.

Monday, June 11, 2012

Richard Feynman Commencement Address

Richard Feynman was a great teacher and arguably the second greatest U.S. physicist, behind none other than Albert Einstein, and also a great teacher.  He believed that, if you couldn't explain a concept in physics to a layman, then you didn't understand the concept.  Something to keep in mind the next time you meet with your financial advisor.

I have been a long-time Feynman fan and have read a number of books about him and his lectures.  I highly recommend Genius by Gleick and his own Six Easy Pieces - even if you aren't interested in physics.  You'll especially like the part where he explains that people believe they are answering a question when actually they aren't.  For example, saying "because it's slippery" doesn't explain why our feet fly out from under us when we step on ice.

Being a fan, you can understand that I was pleased to come across a commencement address by Feynman on Biz of Life's site entitled "Cargo Cult Science."


The message of this piece struck home because I've recently been reading a number of research pieces in financial planning that don't seem to me to be especially rigorous.

It is a fact of life that studying economics and finance has to rely a lot on history.  Sadly, we can't go into the lab and keep everything the same and see what happens, for example, after 2003 if the Fed doesn't lower interest rates to 1% and ignite a housing market boom.  Sadly, we rely very heavily on one historical episode - the 1930s - (which was very different from our world today) to make or support current policy.  In  financial planning, we look at failure rates in withdrawing funds from a portfolio when yields were a lot higher and the economy was at a younger stage and was a manufacturing behemoth.  And from this we get probabilities.

To be clear, the analysis is valuable but it doesn't give probabilities.  This is my point.

An example in sports is the way announcers or analysts sometimes talk about teams.  They'll say, for example, that (fill in the blank with a team) has only won a seventh game of a World Series two times in the last 50 years.  What does this tell us?   Can we derive a probability from this?  Over a 50-year period you obviously have very different teams.  It is hard for me to see this as anything other than a nonsensical observation.  It does, however, get fans riled up.

I'm convinced that the failure to appreciate this observation in finance is behind the ongoing failures of so-called "value-at-risk" models.  These models take historical data (from a world much different from the present) and derive probabilities.  Then they are shocked that the correlations don't hold up!

Understanding Feyman's message goes a long way in understanding how to interpret academic research, expert opinion, and, in particular, the ethical way to present and carry out that research.

Tuesday, June 5, 2012

Would You Take a Lump Sum for Social Security?

Often retirees are offered a choice between a lump sum payment and a pension when leaving a company.  My question is:  would you prefer a lump sum at age 62 or the specified CPI adjusted social security payment for as long as you live?  Assume that the Social Security payment is guaranteed.  Note that taking the lump sum gives you control of the assets, as well as a legacy when you die--assuming there is something left.  Note as well that you have the money to invest and could run up the value if you are an astute investor and the markets are friendly.

To put numbers on it, assume you are 62 today and you can get $2,000/month or a lump sum of $420,022.  Quote was from Berkshire Hathaway Group.

Lump sum or Social Security?

Monday, June 4, 2012

Ray Dalio

For those interested in successful investment managers, it would be hard to find someone more appropriate to study than Ray Dalio.  Ray Dalio is founder of Bridgewater Associates, one of the world's most successful hedge funds.  His funds look globally to find value.

Here is a recent interview Sandra Ward from Barron's did with him: "Dalio's World."  Dalio gives his view on the deleveraging process that is unfolding as well as his thoughts on gold and other investment areas.

One of the really interesting analogies Dalio makes in this interview is to compare present-day Europe and the problems it is having with America in 1789.  In 1789, America was 13 colonies held together by the Articles of Confederation.  The colonies had debts from the War of Independence, and they had tariffs with each other.  The setup was very similar to Europe's present Maastricht Treaty that created the European Union.  It was 13 years after independence that a central government in America was formed that could tax and take on debt and form a Treasury.

Dalio's view is that Europe must decide if it is willing to take that additional step and form a central government.  One has to wonder if this is at all possible given its long time history.
 
One thing that is important in thinking about these parallels is that America had superb leadership in forming its central government.  People like Alexander Hamilton (the only founding father not born in the U.S.) stepped up and performed crucial functions exactly when they were needed.  He, for example, had the Federal Government assume the debts of the colonies and proceeded to pay them off. This in spite of people around him advising that the debts should be reneged on.  After all, no one really expected to be paid back by the poor, fledgling nation.  Because of Alexander Hamilton, it didn't take long before America was one of the top credits in the world.

Another point worth noting is that America at the time was peopled by hungry, aggressive, hard-working peoples who had fled other countries for an opportunity to get ahead.

Dalio makes interesting points on the similar situations but the differences are so magnified, just in the areas of leadership and willingness of the people to find a way out of their debt quagmire, that it is hard to see a  workable solution.  Continually kick the can down the road and it goes off a cliff.

Sunday, June 3, 2012

What is the Treasury Yield Curve?

Yields have been pushed to historically low levels by the Federal Reserve, weak economic conditions, China pegging the Yuan, and a "flight-to-quality" as fears of Europe imploding increase.  One of the best ways to view this is with a graph of the Treasury yield curve:

Source: Barron's
The U.S. Treasury Yield Curve is a snapshot at a point in time of the yield-to-maturity of various maturity Treasury issues.  Issues that mature (i.e., pay back principal) in less than 1 year are called "bills," issues that mature between 1 year and 10 years are called "notes," and maturities out past 10 years are called "bonds."  Thus, the yield curve shows the yields on bills, notes, and bonds at a point in time.

As you can see in the graphic, the curve was upward sloping at each of the 3 dates shown.  Compared to a year ago and a month ago, Treasury yields were little changed for bills, (anchored by Federal Reserve policy) but fell sharply for notes and bonds.

Typically, an upward sloping yield curve presages an expanding economy because it is usually associated with an aggressive Fed policy.  Unfortunately, this hasn't been the case recently for the simple reason that, coming out of 2008, we didn't have so much a liquidity problem as a solvency problem.  Historically, liquidity problems have been solved by the Fed increasing the money supply and banks making loans with the resulting excess reserves.  Today, excess reserves are at record levels; but banks are still loaded with bad debts and are only cautiously beginning to lend.

The Treasury Yield Curve is a useful tool for quickly grasping the movement in rates over time.  If you are interested in looking at historical yield curves, go to Living Yield Curve.  Here you'll find periods where the curve was inverted, i.e., the yield on shorter maturities exceeded the rate on longer maturities. These were times when the Fed was following a tight monetary policy and usually resulted in a slower economy.

Saturday, June 2, 2012

Dealing With Class C Shares

My present project is converting a portfolio of high-fee C class share funds to low-cost exchange traded funds.  The class of mutual fund shares determines when and what and how fees are charged.  To completely understand the fees associated with various classes, you practically need a PhD in Physics.  This is by design.  It is one of the main reasons for the strong growth of exchange traded funds.

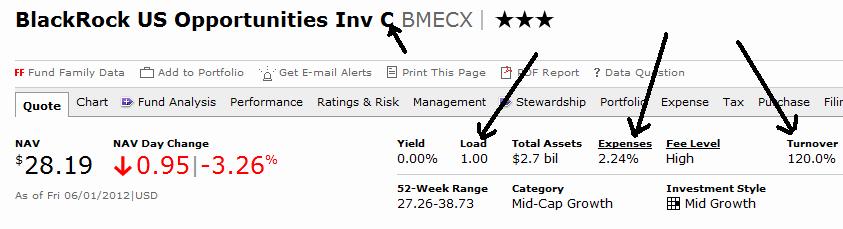
Let's look at an example to understand what these C share funds are.  The client holds BMECX--a "BlackRock US Opportunities" fund.  Put the ticker into Morningstar and find:

Source: Morningstar
CLICK TO ENLARGE  Note the arrows. You can easily see in the title that it is a class C share fund.  This typically means there is a sales charge (a load) of 1% if the fund is sold before holding for 1 year.  Don't ask me how they get away with this.  If you don't like the investment after 9 months and want to sell it, they charge you!  It is worth noting that one of the very first academic findings was that load funds do not outperform no-load funds.  Still they persist.

The expense fee on "C" shares are higher than average.  For load funds (i.e. sales commission funds), you either pay in the beginning, the end, or as you go along.  On this particular fund, the ongoing annual expense is 2.24%!

Note also the high rate of turnover at 120%.  Turnover is defined as sales divided by total value of the fund.  Thus, the entire fund was more than essentially replaced over the previous 12 months.  Trading detracts from performance, even in an environment of low commissions, when it is occurring at this level.

At the Morningstar site, click "performance" and you get:

Source: Morningstar
CLICK TO ENLARGE  Note that the fund is classified as MG (mid Cap Growth) and yet is compared to the S&P 500.  This is obviously not an apples-to-apples comparison.

The fund did well in 2007, 2008, 2009, and 2010 relative to the S&P 500 and relative to its group in the first 2 years.  It was definitely an easy sell (to a potential client) in 2009 and 2010.  But how did it do versus a low-cost, mid Cap growth ETF?  Consider the Vanguard Mid-Cap Growth ETF (VOT).  Put VOT into Morningstar and you find the fee is 0.10%.

Next, start with BMECX again, click performance and in the "compare" box put in VOT.  Also, in the box "add index" pick Morningstar's Mid-Cap index.  This still isn't apples to apples, but it is closer. The annualized return results you get are summarized in the following table.


         1 Year      3 Year      5 Year 
BMECX -15.04 9.35 -0.35
VOT -9.01 15.94 -0.37
Mid-Cap Index -7.25 15.97 -0.71
Rank in Category 92 94 50

The "Rank" is for BMECX.

A couple of points to note.  Over 5 years, the load fund matched the indexed ETF.  This indicates it had some pretty good years because it has not done well over the past 3 years.

This reveals an important message.  There are periods where load funds, despite the fees, will do well. The managers, after all, are usually really smart and have tremendous resources at their finger tips.  The problem, though, is that in the long run, as they are extracting a much higher fee than the index ETFs, they face strong headwinds.

At best, only 2 out of 10 will come out ahead over a 10-year period.  This is what the unbiased academic research finds in study after study.

Disclosure:  This post is for educational purposes.  Individuals should do their own research or consult a professional before making investment decisions.