Investment Help

If you are seeking investment help, look at the video here on my services. If you are seeking a different approach to managing your assets, you have landed at the right spot. I am a fee-only advisor registered in the State of Maryland, charge less than half the going rate for investment management, and seek to teach individuals how to manage their own assets using low-cost indexed exchange traded funds. Please call or email me if interested in further details. My website is at http://www.rwinvestmentstrategies.com. If you are new to investing, take a look at the "DIY Investor Newbie" posts here by typing "newbie" in the search box above to the left. These take you through the basics of what you need to know in getting started on doing your own investing.

Tuesday, May 31, 2011

Biggest Money Mistakes


I am an advocate for do-it-yourselfers. But not for those who do not know, or refuse to learn, the basics.

Some true life stories from "Financially Fit" on money mistakes;

1. Bought vacation home as an investment.

2. Too much money in employer stock.

3. Trusted pro picks and ignored fees.

4. Too risk averse for age.

5. Short-term savings in growth stock.

These mistakes are simple, but very costly, errors people make over and over and are easily preventable. A weekend reading a good investment book (for example, The Elements of Investing by Malkiel and Ellis)
would prevent most of them. No. 1 and 2, for example, are diversification issues. #3 is one that is hammered home by this site and the aforementioned book. The bottom line is most pros will underperform over the longer term and fees will eat up a nest egg. #4 is about asset allocation. The most important consideration in deriving an appropriate asset allocation is age. #5 is covered by a very simple, basic rule - if you need the money within 5 years, keep it in cash equivalents or near cash equivalents.

Again, these are errors that shouldn't be made. They are like drinking too much and driving, skating on thin ice, or driving and texting. Really, you just have to scratch your head and wonder.

To be sure, there are more difficult issues in finance. For example, how to determine the upper limit on student debt to take on in pursuing a college education or the appropriate withdrawal rate in retirement. The mistakes described above aren't in this category.

A short time ago, there was a story in the local paper about a do-it-yourselfer who attempted to hook up a gas dryer. He blew his house to smithereens and killed his wife. Please: if you are not sure what you are doing investment-wise, spend an hour with an investment professional. Avoid the silly mistakes.

Monday, May 30, 2011

Changing of the Guard at Arlington National Cemetary

Happy Memorial Day!


Sunday, May 29, 2011

Looming Debt Crisis - Should I Raise Cash?

The U.S. has reached its debt limit of $14.3 trillion, and now Treasury Secretary Geithner is magically pulling funds from obscure places to keep the country from defaulting on its debt. In the meantime, the players in the sandbox are grabbing their toys and not sharing, especially when there are cameras or reporters lurking in the vicinity. Political pundits are having a field day.

Investment markets view the ongoing stupidity with a jaundiced eye. Been there, done that. It always gets resolved. Check out this chart:

Source: Bruce Bartlett, Invictus

If it doesn't get resolved, bonds default, markets crash, and we have a revote - sort of like we did for the stimulus package. At least that seems to be the thinking of our political leaders. Then we can go back to worrying whether we will have an NFL season. News flash to NFL owners and political leaders:  sometimes it takes a long time for fans to come back.

But seriously, folks, people are starting to get scared. They're asking me if they should raise cash in their portfolios.

My position on this is clear. If it helps you sleep better at night, by all means raise cash. Know though that you should have an asset allocation that reflects your  risk tolerance. For this reason alone, I would advise against raising the cash position by more than 10%  above the planned allocation.

The asset allocation plan is based on the understanding that we'll experience volatile markets from time to time and need to be positioned to ride out the downturns. Riding out the downturns keeps us in the market for when it turns higher, which typically is when the news is bleakest.

Most investors should not worry about near-term developments. Market timing nearly always backfires. Witness those who got out in 2008 and 2009 and never got back in. What most investors are interested in is where markets are 10 to 15 years down the road. Even for retirees, a decent portion of portfolios is longer-term in nature.

For those who do raise cash, there is the problem of when do you get back in? With the debt limit debate, there is much that is going on behind closed doors and over lunch at the Capital Grille . Deals are being struck. Imagine waking up to the headline that the debt limit has been increased and that our political leaders have decided to exhibit some maturity and cut costs as well as raise some taxes. Seems far fetched, but politicians have reached agreements in the past that haven't been self-serving re-election motivated and, instead, have been in the interests of the American people. It's hard to think of any right off the bat, but I know there have been some.

So, bottom line IMHO:  raise up to an additional 10% in cash, if it calms your nerves in these chaotic times, but understand that market timing can be a tricky endeavor.

Disclosure:  This information is for educational purposes. Individuals should consider their specific situation, do their own research, and consult a professional before making investment decisions.

Saturday, May 28, 2011

A Millionaire Teacher

I am proud to introduce Millionaire Teacher: The Nine Rules of Wealth You Should Have Learned in School by my friend Andrew Hallam.

It is in the pre-release stage - expected in October.  Andrew is a remarkable individual teaching English at the Singapore American School. He also has taught fellow teachers at the school, as well as many others via his popular seminars and website, the principles of investing and building wealth on a teacher's salary.

To gain a sense of Andrew's creative approach and witty style, sample some of his writings at his popular blog. 

Some endorsements from giants in the field of personal investing:
Do you spend too much and save too little? Do you wonder why your investments always seem to roll behind the eight ball? In clear, compelling, and highly entertaining prose Andrew Hallam will explain to you exactly why, and what to do about it. And if you’re a non-US resident, there’s an added bonus: strategies for long-suffering Canadian, Australian, and Singaporean investors that can easily be applied to other nationalities as well.
          William Bernstein, author of The Investor's Manifesto
Andrew Hallam has distilled the timeless lessons for investing into nine easy to understand and easy to follow rules.  The newbie investor will not find a better guide than Millionaire Teacher.
          Burton Malkiel, author of A Random Walk Down Wall Street

You can pre-order this book by clicking on the  "RW Investing Bookstore" link on the right or going directly to Amazon.

A few hours with Andrew's book, reading the voice of experience, could very well change the financial path of many people for the better.

Disclosure:  For books ordered through the link on this site, I receive a small compensation from Amazon.


Friday, May 27, 2011

Go the LifeCycle or Target Fund Route?

Don't know how to invest? You or your progeny got better things to do than worry about retirement and building a nest egg? The mere mention of asset allocation give you a headache?

No problem - choose a lifecycle or target date fund and leave the driving to someone else. At least that's a bit of advice widely proffered by both financial planners as well as fund providers. The lifecycle/target date funds do the asset allocation and rebalance over time. What's not to like? Well, the fee for one thing. So let's get out some Excedrin and take another look

Consider the Fidelity Freedom 2050 Fund (FFFHX), a typical recommendation for, say, a 25-year-old who doesn't want to make fund choices. The 2050 fund charges .84%. Put monies into the fund out of every paycheck for the next 39 years, and it will take care of the whole kit-n-kaboodle - at an expense of .84% of the market value of assets each year.

What's the alternative? One possibility is to mimic the basic asset allocation of the 2050 fund. By going to the summary sheet, you can easily find the fund's composition. For example, the fund holds 55% domestic equity. This can be mimicked with the Spartan Total Market index fund (FSTMX) - expense ratio .10%. The 2050 Fund holds 24% in the international equity sector - mimic with FSIIX - expense ratio of 20 basis points. Similarly with bonds.

This portfolio so constructed will have an expense ratio of between .10% and .20%, which, over a long period of time, makes a difference compared to the .84% expense ratio of the 2050 fund. The alternative portfolio will be a bit different from the 2050 Fund because it won't contain some parts of the 2050 fund - like the commodity, the emerging countries, or the high yield bonds sectors. These can be picked up at a later point with monies invested outside the 401k - in a Roth, for example.


Finally, the fund composition should be checked yearly to examine changes in composition. Over time, the portfolio will get more conservative by shifting from equities to fixed income.

This approach produces a slightly different portfolio as mentioned above. The bet is that the differences won't produce materially different performance. In fact, the wailing and gnashing of teeth by the investment community recently over the correlation among asset class returns suggests this could be the case. In any event, the cost is materially reduced with a portfolio costing approximately 15 basis points/year versus 84 basis points/year.

It may  pay to sit down with a professional, pay them an hourly fee, and get set up. I would even start with your 401k rep if interested in going this route - either way it should minimize any resulting headaches.

Disclosure:  This information is for educational purposes only. Investors should consult with professionals and do their own research before investing.

Thursday, May 26, 2011

Google Correlate - A New Tool

Google Trends allows us to examine how a search item moved over time and was affected by events. For example, go to Google Trends and  type "Charlie Sheen" in the search box and you can see events that triggered searches for Charlie Sheen - for example, you see the spike when he was arrested, etc.

Now Google has an app that shows you correlations with a given search item. To see the comic book explanation, check out this link.

Here are the correlations with "monetary policy":
Source: Google
3rd item "psychological disorder" ... at 93% hmmm! Makes sense to me!

Future Crises Not Likely to be as Bad as 2008

Treasury Secretary Geithner on Wednesday told Politico that, although there will be crises in the future, they won't be as bad as 2008.

On the one hand, this is good news. It implies that a 50% drop in stocks, like we saw in 2008 and early 2009,  is not likely.

On the other hand, it raises questions about the naivety of the Treasury Secretary. Does he not grasp the enormity of the Federal budget situation and the dysfunctionality of the U.S. political system. Has he ever asked himself what will happen if interest rates spike higher? Does he grasp the implications of a world where the leading economic power is communist and it is stealthily buying up natural resources around the globe? Does he not fully grasp that crises come in different forms?

His reasoning is that the regulators have the necessary authority from the Dodd–Frank Wall Street Reform and Consumer Protection Act to step in to nip a crisis in the bud.

But this isn't the way things generally work. Setting up a system to solve the last crisis doesn't prevent the next one. In the 1930s, FDIC was established to alleviate bank runs. Guess what? In 2008 we had potential bank runs in a different guise - runs on money market funds.

Treasury Secretary Geithner's demeanor and overall guidance on the debt limit situation could, in fact, set off the next crisis. His "oh well, we've reached the limit but I have tricks I can pull to keep the government running" is just forestalling the necessary increase.  It is giving unwarranted comfort to people that we have time to solve the problem.

Instead, he should be out front with names of people who will be fully responsible for setting up a flight from Treasuries if  it reaches that point. He should emphasize that the American people do not deserve to have the global financial system tested because of outsized political egos. He should be emphasizing that an interest rate spike is possible if we come to close to the point of default.

 In 2006, Greenspan and Bernanke said the housing market weakness was not a serious macroeconomic problem. Today Treasury Secretary Geithner says future crises will be less bad.

I hope he's right!

Wednesday, May 25, 2011

What is the Difference Between Broker/Dealers and Fee Only Registered Investment Advisors?

A Challenge

A huge challenge for U.S. workers over the past 20 years has been that we've been put in charge of managing our own retirement assets. Defined contribution plans via the 401k and its brethren have replaced defined benefit plans. This means we have been put on the front line of understanding the trade-off between risk and return, the principles of portfolio construction, and the art of rebalancing. And this has put us face-to-face with fund providers.

Fund providers for 401ks are broker/dealers. They are product sales people. With most 401ks, participants have no choice - they have to go with the fund provider. This can be very costly; but if the company has a match, this is still the way to go. In the process, Wall Street enriches itself on the backs of participants and companies - but that's a whole different story.

Over time, the process evolves for many of us . We change jobs, roll over 401ks, amass savings outside the company 401k, etc. This presents choices. We can continue the broker/dealer route, go with a registered investment advisor, or go it alone. Understanding the alternatives between broker dealers, i.e. non-fiduciaries and fee-only RIAs, i.e. fiduciaries is important and can be a critical factor in this decision.

Most of us first became acquainted with the broker/dealer in a company meeting held by the human resources department. He or she explained the plan, the matching features, and the investment choices. Typically it was a lot of jargon, it involved a lot of multi-colored charts, and if it lasted more than 30 minutes, it led to eyes glazing over and considerable nodding off.

The results of these meetings are disheartening when seen from my side of the table. I've seen too many portfolios of high commission, load funds, paying 12b-1 fees and excessive management fees that have eaten away at workers' nest eggs.

Fund Costs

As an aside, here is an estimate of average fund costs by William Bernstein from The Investor's Manifesto:

Source: Bernstein, The Investor's Manifesto, p. 80
CLICK TO ENLARGE  These totals don't even include possible load fees! Which funds do you think a rep that is paid on commission will steer a participant towards?  How can funds charging these fees on an annual basis outperform markets over the long term?

 Fiduciaries vs. Non-Fiduciaries

These human resource meetings take place every day across the country, and many college graduates will soon attend them. The important fact to understand is that the presenters are not fiduciaries. This simply means that they do not necessarily have the participant's best interests at heart. Their allegiance is to their company and to their stock holders.

To see exactly how this works, ask some questions? To begin with, ask the plan rep how they are compensated. Ask them how it is that they offer funds outside of their family of funds. Ask them how and why these funds were chosen and how they get compensated when people choose these funds. Ask them why the introductory booklet they handed out, that describes the funds offered, doesn't have the expense ratio of the funds presented. In getting answers to these questions all I can say is "good luck."

Supposedly starting next year, fund providers will be dragged front and center and be required by law to fully disclose all costs. This is a huge step in the right direction because for the first time 401k participants will be able to understand exactly what their plan participation is costing. Don't be surprised if some of the big players announce fee cuts. This should tell you something.

In contrast, the fee-only registered investment advisor gets paid only by their clients. In other words, they don't sell products and, thereby, get paid commissions on what they sell. RIAs are fiduciaries. They are required to disclose all conflicts of interest. For example, if they refer you to an estate attorney from whom they get referrals, it has to be disclosed.  Most important, a fee-only RIA has no incentive to put you in a high-priced fund. Indeed, if they are paid a percentage of the market value of your assets, they have a strong incentive to see that costs are minimized.

Disclosure:  I am a fee-only registered investment advisor.

Tuesday, May 24, 2011

Interested in 2.35% for 11 months?

Being on the institutional money management side for a number of years, I had many conversations with colleagues about the huge discrepancy between what institutional traders transact bonds at as compared to individuals. In short, individuals face huge markups in the bond market when buying odd lots and huge markdowns when selling. For example, if you buy $50,000 principal amount of a 5-year IBM issue, you would pay a much higher price than an institution buying $5 million of the same bond. This is why today I recommend against individuals buying bonds and instead suggest bond index funds.

This goes beyond the fact that the bond market is an over-the-counter market and the institutional buyer gets coverage from numerous firms.

This, of course, always led to my wondering whether there wasn't a business opportunity available by giving better bid-offer spreads to the retail market.

My friends and I were never smart enough or energetic enough to figure out how to do this, but also the technology wasn't really there. Today this has all changed - at least the technology part. Investors are getting better opportunities to get competitive prices.

Along these lines, I recently came across a very interesting site at Zions Bank. Although I haven't used it, I have been following it and have to say that it looks promising for those, with time on their hands, who are in search of higher yields to follow ongoing auctions.

The site offers auctions (instructions available at the site) as follows:
Source: Zions Bank

CLICK TO ENLARGE  Note the Verizon 11-month bond yielding 2.35%. Again, if individuals have the time to do the research and follow the auctions, these types of issues at attractive yields are available for bid.
 
Click on "view auction" and you get:


CLICK TO ENLARGE  Here you see that there are 5 bidders and when the auction ends, along with detail on the issue.

Although I haven't used this auction site, I do find it interesting and potentially useful, especially for those seeking income.

I would be very interested to hear of the experiences other investors may have had with the site.

Monday, May 23, 2011

Markets at the Crossroads?

Robert Johnson
Sometimes a couple of simple questions are all that's necessary. Is Fed policy easy and is fiscal policy stimulative? If so, I'm jumping in.

The economy has come through a period of unprecedented robust fiscal and monetary policy, necessary to extricate an economy mired in quicksand and sinking up to its eyeballs in the Great Recession of 2008. On the fiscal policy front, payroll taxes were cut, the Bush tax cuts extended, and the Federal deficit pumped up to $1.4 trillion. Not long ago, economists pulled their hair out over $600 billion deficits. Times have changed.

On the monetary policy front, short-term interest rates were cut to zero and two episodes of quantitative easing carried out. This amounts to  nothing more, of course, than printing money which has always ended badly when carried to an extreme.

On the international front, the dollar has imploded, thereby lowering the price of U.S. goods on global markets.

Cheered on by Fed Chairman Bernanke, the market has embraced it all. Stocks have been on a moonshot since 3/2009, and over the past 12 months the S&P 500 is up more than 26%. Last week, markets were even reminded of the dot.com era with the LinkedIn IPO.

Much of the above is viewed by many, especially Fed Chairman Bernanke and Treasury head Geithner, as highly successful policy.

Now, however, markets are approaching a cross roads reminiscent of Blues great Robert Johnson's journey-- although there is likely to be no pact with the devil this go around.

Although jobs are finally being added at a meaningful rate, inflation is picking up and the citizenry is clamoring for Washington to get its spending under control amidst wrangling over the debt limit.  The Fed has an exit plan, at best viewed as shaky, that necessitates wrapping up its money-printing binge and raising short-term interest rates. The dollar has shown signs that it wants to rise.

The question turns to whether the economy has its sea legs  and can take it from here. The problem with artificial stimulus is that there always comes the point where it should be reversed and needs to be paid for ( for members of Congress - this means chronic deficits lead to a day of reckoning); and when it is reversed, it is a tightening. For example, if you pass a temporary tax cut and you want to reverse it, it then becomes a tax increase. The Fed increasing the fed funds rate (expected in 2012) will be viewed as a tightening.

To say the least, it will be interesting. Most economists predict GDP growth north of 3% for the balance of the year following the surprisingly weak first quarter report that is expected to be revised upwards. Most observers put the market P/E ratio at slightly on the pricey side. It is important that investors have a well thought-out asset allocation plan to ride out the potential  choppiness.

Sunday, May 22, 2011

Advice for College Graduates

Eileen Ambrose of the Baltimore Sun has excellent advice for new college graduates. I would add a couple of observations.

First, the new graduate should do what has to be done to take advantage of the company match in your 401k. If this means making sandwiches at home and carrying water in a thermos - do it. As an aside, you can make a pretty good sandwich for under $3.

In investing in your 401k, if you are not sure how to pick funds, consider spending an hour with a registered investment advisor (spending no more than $150) and going over your choices. Fund providers (Fidelity, TRowe Price) are brokers, not registered investment advisors. Many will steer you to pricey investment choices. For example, they will recommend their target date funds to uninformed investors that charge upwards of .70%, when they have other funds at much less that capture the returns of the overall market. The difference doesn't sound like much, but it is significant over the 40-year period you will work and contribute to your 401k.

This is the same advice  I gave my youngest daughter recently as she had to choose funds managed by Fidelity.

Secondly, read  I Will Teach You to be Rich by Ramit Sethi. This book will teach you about credit scores, how to set up your bank accounts, insurance  - in short, just about everything a young professional  needs to know to get on the right financial path. Also, it is written in a style that appeals to young professionals - unlike so many financial help books on the market today.


Mr. Sethi's blog, "I Will Teach You to be Rich," will give you a feel for his writings.

Disclosure:   I offer the hourly consulting service described above. Generally it involves either a phone conversation or an in-person sit down to go over the 401k choices and arriving at a definite plan of attack. If necessary, a pep talk is thrown in to emphasize the importance of starting the retirement saving at a young age!

Friday, May 20, 2011

How to Analyze a Dividend Stock


You've read about the attractiveness of dividend paying stocks, especially in an environment of historically low interest rates. As a do-it-yourself investor you want to pick your own stocks. How do you analyze this sector?

Fortunately, you don't have to reinvent the wheel.  At your fingertips are some really great approaches. Here's one by "Dividend Growth Investor" as revealed in his analysis of  3M. These are some of the things he looks at:

  • sector (important to ensure that diversification is kept at the forefront)
  • is it a "dividend aristocrat" ? (member of the S&P 500 that has longevity and consistency in raising dividends
  • major competitors (GE et. al.)
  • annualized return over 10 years ( 8.6%...double investment in 8.4 years!)
  • earnings per share growth rate for current year and 12 months ahead (graph of earnings per share)
  • return on equity over 10 years (graph - shows return has consistently exceeded 27% over the decade)
  • dividend payout over 10 years (graph )
  • dividend payout ratio ( sustainability indicator)
There is much more in his analysis including important commentary on 3M's R&D spending, entry level target etc. All-in-all Dividend Growth Investor provides an excellent approach to analyzing dividend stocks. 

As always I recommend limiting investments in single names (stocks and bonds combined) to 5% or less of investable assets.

Disclosure: This post is intended solely for educational purposes. Individuals should do their own research or consult professional advice before investing.

Thursday, May 19, 2011

President Obama's Asset Allocation

According to recently released financial disclosure forms, the Obamas have the bulk of their investable assets invested in Treasury bills and notes. On the basis of the broad ranges reported on the disclosure forms, only approximately 10% is invested in equities via an S&P 500 index fund.

Given his age (49 years old) , employment status, and income, the President is obviously well positioned to take on risk. In financial planner speak he  has considerable capacity to take on risk in expectation of higher returns.

Furthermore, his career choice indicates  a high tolerance for risk.

At the very least he would be well advised to think about investing in a total stock market index fund, an all world ex U.S. fund and more aggressive fixed income funds. Probably at least 60% of total assets should be directed to stocks.

On a positive note,  fund expenses are minimized and he and the First Lady have made sure that the kids' education is well funded.

Wednesday, May 18, 2011

High Dividend and Momentum by Kapitall

The sector du jour is high dividend stocks.  As MoneyCone showed yesterday, a portfolio of high dividend stocks did well over the "lost decade."

Now here's a piece that looks at high dividend stocks and adds in momentum by using moving averages.  Let me say at the outset that I'm not a fan of technical analysis.  For that matter, I'm not a big proponent of high dividend stocks, except as part of my overall portfolio.  I hold high dividend stocks as part of my total market exchange traded fund. When I see research showing that high dividend stocks outperform over longer periods, I'll overweight them.  Until then, I'll hold them as part of my total market holding and give an overweight to small cap stocks.

In any event, I thought "20 Rallying High Yield Stocks With Excellent Dividend Coverage" would interest some of you both for the analysis presented as well as the resource used,  the interactive graphic by Kapitall.

Notice the information available for the list of stocks:

Source: Kapitall
This resource lists up to 20 stocks and shows the industry and a 12-month graph of each holding under "Stock Information."  Each of the items in the list are worth looking at. Clicking "Management," for example, shows you the company CEO, his or her salary, and total compensation. Clicking "Opinions" gives you a price target and even a "green" rating!

What I especially like is the diversification information as shown below.


Source: Kapitall
A second drop-down list allows the user to list the holdings by sector which is also useful for diversification purposes.

Overall, I think this resource is worth taking a look at for many do-it-yourself investors.

Disclosure:  This post is for educational purposes.  No stocks are recommended.  Individuals should do their own research or consult a professional prior to investing

I am not affiliated with Kapitall.

Tuesday, May 17, 2011

What is Negative Convexity?

Investors today are scrambling for yield, and one place they are looking is at funds of mortgage-backed securities. An example is MBB, a popular exchange traded fund, which is comprised of GNMA and FNMA mortgage-backed securities whose principal and interest payments are guaranteed by the U.S. Treasury.

Do-it-yourself investors know to consider the yield-to-maturity of funds along with the duration. These reveal the interest rate risk of a particular fund, and the key question is whether the yield compensates for the underlying risk.

This process is a bit trickier in the case of mortgage-backed securities because of negative convexity. Although ominous sounding, it is easy to understand.

Let's begin with the very first concept learned about bonds:  that yields and prices move in opposite directions. How much prices move when rates drop is determined by duration. The greater the duration, the greater the price volatility for given swings in yield. All of this depends on the coupon interest payment and the maturity of the bonds in the fund. But here's the kicker:  mortgage-backed securities don't have a maturity - they have an average life. And the average life changes as yields change. This is the callability feature of bonds in spades!

You may not have thought about this before, but you very likely have contributed to negative convexity by refinancing your mortgage. Because homeowners refinance when mortgage rates fall and hold on to mortgages longer when mortgage rates rise, the average life varies inversely with yields. In essence, you are buying bonds and not knowing their maturities! As a result, mortgages are considered to have an average life of 12 years.

The bottom line of all of this is that a fund of mortgage-backed securities will be paid off quickly as mortgage rates fall (in other words you have a portfolio of shorter term mortgages than you bargained for) and will extend in average life when interest rates rise. As a result, mortgage-backed securities tend to do well when yields stay within a given band (in other words, prepayment surprises are minimal) and under-perform when there are significant changes in rates.

Should you buy mortgage-backed security funds? It depends on whether you think mortgage rates will stay fairly stable or if you think they will go off on a trend upwards or downwards. It is very likely that many investors will be surprised if interest rates trend meaningfully higher over the next few years, as many observers think likely.

For the math geeks - duration is the first derivative of price change related to yield changes, and negative convexity is the second derivative.

Monday, May 16, 2011

Have We Run Out of Options?

On Saturday I attended the monthly meeting of the American Association of Individual Investors in Baltimore featuring  Senior Economist Russell T. Price of Ameriprise Financial. The presentation was wide-ranging and covered the broad areas of the macroeconomy. The focus was on the consumer, and the conclusion was consumer spending would do fine despite higher gasoline and food prices. Automobile sales was one indication of consumer confidence. Along with the usual caveats, the U.S. economy should continue to progress in 2011. First quarter GDP is expected to be revised higher, and the remaining 3 quarters to see growth of 3.5% and higher. Early 2012 is expected to see growth below 3%.

One intriguing chart showed crude oil prices (West Texas Intermediate) rising in tandem with dollar flows into commodity funds since 2003. This chart was used to theorize that commodity prices are heavily influenced by exchange traded fund participation. Mr. Price pointed out that ETFs enable individual investors to participate in the commodity markets without being part of the "price discovery" process. After all, he pointed out, individuals don't take delivery of the commodities and don't produce products using the commodities. They are using ETFs to "bet" on commodity prices. Commodity prices, therefore, are heavily influenced by individual investor speculation - not just by professional hedge fund activity.

Overall, the charts supported his contention that the economy is slowly improving and that the odds of a new contraction are slim.

One point bothered me, however. He pointed out that, when the economy hits a bump, we have have two broad macroeconomic policy responses:  fiscal policy and monetary policy. The fiscal policy response to a slowdown is to lower taxes and increase government spending.  The U.S. has done that in spades. The deficit is estimated at $1.4 trillion, and the payroll taxes have been cut 2%. The Bush tax cuts have been extended. On the monetary policy front, Bernanke has pushed short-term rates to 0% and engaged in two massive bond buying programs known as quantitative easing.

What  bothers me is that I wonder if we are at the end of our policy response choices.  Are we out of dry powder?  Just a few years ago, we were wringing our hands over $600 billion deficits. Now we pretty much accept a $1.4 trillion deficit. We readily accept quantitative easing (the stock market actually embraces it!) even though we know it is printing money and blowing up the Fed's balance sheet to heretofore unimaginable levels. As a matter of fact, political correctness prevents polite people from calling it what it really is - monetizing the debt.

All of this is reminiscent to me of the frog-in-the-frying-pan metaphor. If a frog jumps into a hot pan, it will jump right out. Put a frog in a cold frying pan and slowly turn up the heat, however, and it will stay in the pan until it's fried. My concern, as I listen to economists present economic forecasts, is that they are missing the turning up of the heat.

Sunday, May 15, 2011

On Lifecycle funds...

I am ambivalent on lifecycle funds. I like the idea that many 401k plans automatically opt-in new employees and put them in a lifecycle fund that changes asset allocation over time. Asset allocation is the single most important decision required of  new investors, and it can be the hurdle that they fail to get over. What percent of my assets do I put in stocks and what percent in bonds? Lifecycle funds solve this problem.

Research and actual participation evidence shows the opting-in feature significantly increases participation in retirement accounts--which is important. I guess it also proves that many people are too lazy to check a couple of boxes and sign the bottom line, but that's a whole new subject area.

Also, I see the value of lifecycle funds as an investment vehicle for those who just don't want to be bothered thinking about investments. Those caught in the headlights can just buy the lifecycle fund and stick with it. It is a lot better than wringing your hands and procrastinating on the savings program. With lifecycle funds. there is absolutely no excuse for not starting a retirement savings program.

The lifecycle funds are intended, of course, as an investment for all assets. Many people don't understand this and pick them as an investment choice among several other fund--which doesn't make sense.

The main drawback of lifecycle funds is that they are a one-size-fits-all solution. Unfortunately, investors come in different sizes. In other words, for example, all 65-year-olds aren't the same. Some have concerns about running out of money and need to be a bit more conservative. Some are flexible and are willing to take on additional risk to achieve their financial goals. Others have sufficient assets and running out of money is not a concern. Their primary goal is leaving assets for heirs and for charities. They have the capacity to take on more risk in search of higher expected returns.

The bottom line is that, IMHO, lifecycle funds are a good starting point for thinking about asset allocation. If a person's goals are pretty much in line with the average investor and the volatility of the fund has been examined and is acceptable, then it is a good, easy way to go. If these conditions aren't met, then it makes sense to do a bit more research and learn how to tailor a program to align with specific needs and goals.

Saturday, May 14, 2011

BlackRock 2010 Periodic Table of Returns and Macroeconomic Data

For those who take the long view in investing, the BlackRock "20 Year Periodic Table of Returns" looked at yesterday is a useful DIY investor analytical tool. It shows yearly performance of various market segments including value, growth, small cap and large cap stock indices. It shows performance of bonds as well as cash equivalents and a foreign sector. It also throws in the performance of what I like most - a diversified portfolio. 

In viewing the chart, keep in mind that it shows one 20-year path. The path corresponds to a particular economic backdrop. It occurred to me that some DIYers might wonder about the economic background in terms of specific macroeconomic magnitudes as they view the path of returns and like to know where they can view a graph of macroeconomic magnitudes.

Actually, this can be accomplished easily with the Economagic site. 

For example, to view the broad economic background, here is an easy way of drawing a 20-year graph of real Gross Domestic Product (GDP). GDP is the market value of the total output of goods and services for a particular period of time. A useful way to think of GDP is that it would be the cost if you wanted to buy all goods and services produced within a country over the past 12 months. Real GDP adjusts for the impact of prices over time.

To get the graph, go to www.economagic.com and click "Most Requested Series." At the top is "Real Gross Domestic Product." Click "chart." Scroll down slightly and change the starting and end dates to correspond to the BlackRock table. I also like to put in grid lines and recession bars as shown:

Source:Economagic
CLICK TO ENLARGE


Scroll down and click "make char.t. It's that easy!

Source: Economagic

The chart shows  that, over the period covered by the BlackRock chart, the U.S. economy experienced 3 recessions - was actually coming out of a recession at the beginning of the period. The last recession is actually called the "Great Recession." It was the worst economic downturn since the Great Depression of the 1930s.

At the Economagic site, the reader will note the many variables that can be plotted, including interest rates and monetary magnitudes. Actually, more than one series can be put on a graph. Also note that the data can be transformed in various ways which you'll want to do with inflation indicators, for example.

By the way - if you want to buy all the goods and services produced in the U.S. over the past 12 months you'll need approximately 15 trillion dollars!

Does Your 401k Offer Low Cost Index Funds?

DIY Investor recently looked at the offerings for his youngest daughter's 401k and shared his thinking on fund choices and asset allocation. The critical factor in this whole process, when it got to the actual fund-picking point, was fund expense. Over and above everything else, over the long term, fund expense influences bottom line performance. Simply put, choosing lower expense funds can mean big bucks over the long term. As it turns out, the lowest expense funds are typically index funds because, simply, you are not hiring managers to make buy/sell decisions and do a lot of research. In the case of my daughter's 401k, Fidelity's Spartan Funds fit the bill.

What should the reader get out of all of this? First, pay attention to the benefits package when considering a job. Immediate pay  may not be the most important consideration. This is lost sometimes on young people, and  they literally pay a huge price later. Secondly, if you are in a job and appropriate 401k choices are not offered, talk to Human Resources and see if you can get changes. Very simply, you should be offered at least 3 low-cost index funds for the following market segments: overall stock market, international stocks, U.S. bond market.

Some really good background on all of this is provided by Ron Lieber of the New York Times in "Why 401 (k)'s Should Offer Index Funds."  According to Lieber, only 37% of 401ks offer all three of the index funds mentioned. Also, understand that the fund administrators at your company are fiduciaries. ERISA explicitly states that they are legally bound to take into account plan expenses in selecting investment options.

Wednesday, May 11, 2011

BlackRock 2010 Periodic Table of Returns

Source: Cedar Advisors/BlackRock
The 2010 BlackRock Table of Returns through the end of 2010 covers 9 asset classes/indices on an annual basis from 1991 through the end of 2010. It covers the S&P 500, growth stocks, value stocks, foreign stocks, and bonds. For the first time, it puts in a commodity index and includes the 3-month Treasury bill.

For each year, the categories are ranked with the top-performing sector at the top and the remaining sectors in descending order, all on a color-coded basis.

As in the past, a diversified portfolio--basically 65% stocks/35% fixed income--is also shown. It is notable that the diversified portfolio is never among the poorest 3 performers and only in the top 3 once. Thus, it illustrates the dampening quality of diversification. Over the 20-year period, the diversified portfolio achieved an average annualized return of 8.89%/year (4th place on the list), slightly below the S&P 500 annualized return of 9.14%.

Tuesday, May 10, 2011

A Great Graduation Gift!

Bemoaning the lack of financial literacy among the young is a popular pastime.  The problem involves the need for programs in the high schools, the lack of interest among students, and  the ever-evolving complexity of the financial services industry.  The result is that young people enter the work force and inevitably make numerous mistakes ranging from losing control of their credit cards to not saving enough early enough.

I Will Teach You To Be RichHere is a step in the right direction.  When you show up at the college graduation barbecue party, put a copy of  I Will Teach You to be Rich by Ramit Sethi on the gift table.  This book speaks to young people and covers all the areas that a young person starting their first "real" job, getting ready to set up a household, and initiating a retirement savings program needs to know.  When they are getting their first "real" paycheck, all of a sudden the subjects in this book become highly relevant.  Timing, as in so many areas of life, is important.

The book is set up as a 6-week program and lists actionable items for the reader.

I recommend it highly.

Monday, May 9, 2011

Financial Advice for the Younger Daughter - Part 3

Smith Island cake
OK... for the past two days I've looked through the Fidelity booklet explaining 401k choices available for my younger daughter's company's retirement plan. She needs help - she's a 23-year-old pastry chef starting a new job. Her expertise is making creme brulees and Smith Island cake - not in picking mutual funds.

We looked at the available fund choices  and stressed the importance of fees over performance. Hopefully the point got through. College graduates as well as many others will be going through a similar exercise  (April non-farm payroll +244,000)  in the coming months. The crucial point:

Over the long run,  index funds with lower expenses have performed better historically on average than higher expense actively managed funds and past performance of actively managed funds has  not been indicative of future performance.

Thus, using the low-cost index criteria, we selected from the available domestic equity choices the following:

  • Spartan 500 Index - Investor Class (as guessed by MoneyCone)  - ticker FUSEX
  • Spartan Extended Market Index Fund - ticker FSEMX

Using the same approach, we go back to the booklet and find:

  • Spartan International Index Fund - Investor Class - ticker FSIIX

This latter fund has an expense ratio of 0.2% - very low for an international stock fund.

On the bond side, we use the same criteria. We are looking for a low-fee index fund. The choice I recommend is:

  • Fidelity U.S. Bond Index Fund -ticker FBIDX

(Note:  this fund had a large tracking error a couple of years ago - sometimes that happens!) with expense ratio 0.22%.

Asset Allocation

With the funds picked out, the next order of business (and actually the most important)  is to decide on asset allocation. At 23 years old, she should participate heavily in the stock market. She can stand the ups and downs. Furthermore, a declining market would help her take advantage of dollar cost averaging - buying more shares at lower prices with a given amount of money. So, I recommend 80% stocks, 20% bonds.

In the stock sector, I would recommend 30% in large caps with FUSEX, 30% in the extended index FSMEX, and 20% in international index FSIIX. These percentages are in terms of her overall contributions out of each paycheck. The remaining 20% goes into FBDIX as the bond allocation. FBDIX is indexed against the Barclay's Aggregate Bond Index which is representative of the whole bond market.

As a matter of information, the extended market index is a completion index. In essence, it includes the entire stock market except for the Dow Jones 30. Thus, it includes small and medium cap value and growth stocks etc.

Nobody knows what will happen in the future; but if the stock market should hit an air pocket and drop 10% or more over the next 6 months, I would suggest that she increase both balances and contributions by 5% to FUSEX (big cap stocks) out of the bond portion  (FBDIX) and continue if stocks continue to drop.

Additional Considerations

At the same time she is building up her 401k, she needs to scrounge and build up an emergency fund. She is getting extra pay for working overtime, so this is a source for these funds. We need to check out her disability insurance - when it kicks in and how much she gets. Many workers over the course of a 35 - 40 year work period will experience disability. At that time, it will be the most important consideration in her financial life.

If she has funds above and beyond her living expenses and 401k contributions, a Roth IRA would be worth considering.

The bottom line is that, if she follows these simple steps and goes on a mission to be the best pastry chef she can be, she will one day wake up to a 55- or 60-year-old birthday party and have a lot of paths she can take involving pretty much whatever she wants to do with the rest of her life.

Some people may think that the Fidelity reps would help her with all of this. As our president is fond of saying, "Let's be absolutely clear."  Fidelity reps are brokers. As such, they are not fiduciaries. The interest of clients is not their primary concern. Registered investment advisors are fiduciaries. By law, they have to disclose conflicts of interest and how they are compensated. For fun, I will ask her to ask the Fidelity rep how he or she is compensated. This crucial distinction is lost on the investing public and surely on budding pastry chefs. Some Fidelity reps are great and some not so much. Some will confuse 401k participants to the point of tears. Others will steer them in the right direction.

Disclosure:  This post is intended for educational purposes only. Individuals should do their own research or consult a professional before making investment decisions.

Saturday, May 7, 2011

Financial Advice for the Younger Daughter - Part 2

One of my best jokes in front of the classroom is to announce that I'm going to "recap" as I make a production of putting  the cap back on the dry erase marker - OK , not that funny,  although it does get a couple of chuckles and plenty of moans.

Anyways....to recap...

Yesterday I was into the "Your Guide to Getting Started" booklet put out by Fidelity for 401k participants. I'm advising my daughter on her participation and trying to look at it from the perspective of a young pastry chef. We had reached the point where we noted there is a wide range of choices, all kinds of classes of funds, and a lack of information. We had reached the white water.

My wild guess is that probably no more than 20% of the people handed this booklet get past skimming the fund descriptions. Furthermore, anyone who wonders why 401k participation is low  has their question answered after looking over the booklet. Imagine a pastry chef reading this for the description of the "PIMCO Total Return Fund" :

"The fund normally invests at least 65% of assets in a diversified portfolio of Fixed Income Instruments of varying maturities, which may be represented by forwards or derivatives such as options, futures contracts, or swap agreements."

Uhh...OK...I guess.

So what do participants need to know to pick appropriate funds? Let's start with how not to do it by putting the choices in table form.

Under the category "Domestic Equity Funds," the following choices are available in the "Your Guide to Getting Started" Fidelity booklet. The data shown in the table comes from Morningstar (just put the ticker symbol in at their site). The data is expected to be reliable but can't be guaranteed.

Source: Morningstar

It is important to note that sometimes there are too many choices. There can be a "deer in the headlights" situation. People back off and can't make a decision and therefore don't participate. (Not true when I have the choice of a lot of desserts, but that's another story!) Also, too many choices can result in an ongoing negative feeling because there will always be choices that do better than the choice you made.

The available funds under this single category offer widely-ranging investment types. They include small companies, large companies, so-called value stocks, and growth stocks as well as blends. The "Rank" shows how they performed relative to their peers.

At first inclination, there could be a tendency to select based on the performance ranking. Unfortunately, that's typically not a good approach. In fact, go to Morningstar and put in the ticker symbols, and you'll find many of the lower ranked funds in the table have relatively high ranks for the 3-year period. Think about it--this means they would have had a high ranking 12 months ago. Also, they wouldn't even be an available choice if they hadn't had exceptional performance in the past. The bottom line is that exceptional performance doesn't tend to persist. More directly:  selecting funds on the basis of their past performance can be hazardous to your investment health.

Next time, we'll get to the recommended allocation. For homework, see if you can pick the two funds I will recommend.

The information presented here is for educational purposes only. Investors should do their own research or consult with a professional advisor before investing.

Friday, May 6, 2011

Financial Advice for the Younger Daughter: Part 1

A bit of back story:  The younger daughter graduated from the Culinary Institute of America in New York as a pastry chef, worked for several months in Australia, spent time traveling in New Zealand and India, and now is taking her first "real" American job at a restaurant opening on the Eastern Shore in Maryland. She is 23 years old--soon to be 24.

Mom moves her into her new apartment. Pop gets the details on the 401k.

Keep in mind I've managed assets for 30 years as we try to look, from the perspective of a young pastry chef,  at "Your Guide to Getting Started" put out by her fund provider Fidelity. Also keep in mind that Fidelity is one of the biggest players in the 401k market.

The booklet starts out with something us investment types (of which I guess I'm one)  like:  a bar graph showing the importance of saving and investing as soon as possible. It assumes a certain salary and shows her account balance at certain ages depending on the percent of salary contributed and a 7% return average annualized return. Great stuff. Not sure what the typical kitchen person or wait person will get out of it, but still all financial planner/investment types love this stuff.

Page 4 gets into eligibility, how to enroll (go to www.401k.com) and how to complete beneficiary form. It indicates when enrollment is effective, how much can be contributed, and how previous 401ks can be rolled into this one.

Next are two really important points:  matching and vesting. Her plan matches 100% of the first 3% contributed and 50% of the next 3%. So, for example, if she makes $40,000/year, she will contribute $2,400 (.06*40,000). The company will chip in $1,200 for the first $1,200 and $600 for the next $1,200. The total contribution then would be $4,200 for the year, with $1,800 of that being "free money."

On the very next phone call, my pressing question is "Jill, can you put 6% of what you make pre-tax into your 401k?"

Over the next 40 years, if the average annual return of the investment is 8%, that single contribution for her first year working will have grown to $91,243,  (4,200* (1.08)^40) ! Her father's advice:  do what you have to do, but contribute the 6% of salary to take full advantage of the match.

Next, the booklet points out that, to be fully vested, you have to work for the restaurant for 2 years. Tack on advice:  plan on working 2 years.

OK...so far so good. Everybody's on the same page. The rest of page 5 in the booklet talks about taking a loan from the account (don't do it), withdrawals (forget about it), planning for retirement ( start reading it in 30 years). So basically, up to this point, she really didn't need me. In fact, very little of these first few pages needed to be read. The bottom line is participate up to the match. It is important not to get bogged down in minutiae because the brain numbing part is straight ahead - in other words, the whitewater is right around the bend.


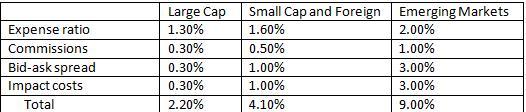
Page 8 starts with the investment nitty gritty. There we find an investment spectrum showing the list of investment choices in an horizontal framework ranging from most conservative ( money market) to more aggressive ( "Select Leisure Portfolio"). Here we get the line "For more complete information about any of the mutual funds available through the plan, including fees and expenses, log on to ...".  In fact, jumping ahead, there is nothing in the booklet as far as I could tell that specifies fees and expenses, although I can't swear to it because there is an awful lot of fine print.

Next we get into the fun part, and remember we are looking at this through the eyes of someone trained in the culinary arts. It makes us want to throw a recipe for creme brulee in front of the Fidelity reps and tell them to go make it and their future depends on how it turns out.

The Investment "Options"

 There are 35 fund choices. There is the "Buffalo Small Cap Fund," the "Fidelity Contrafund," and Oakmark Equity and Income Fund Class I" fund. In fact, looking across all the funds, there are all kinds of classes including "investor class," administrative class," "class I," "class P," etc. There are indexed funds and enhanced indexed funds. There are even "hybrid funds" and a "Four-in-one Index Fund."

Tomorrow we'll move deeper into the abyss and think about appropriate investment choices for a budding pastry chef.

Thursday, May 5, 2011

Investment Management Fees - A Different Angle

DIY Investor is a proponent of paying attention to investment management fees and seeking ways to reduce them. Fees eat up a goodly proportion of people's nest eggs; and they aren't easy to detect because they are, in many cases, hidden. Fees come in the form of investment advisory fees, expense ratios, trading costs, 12b-1 fees, and the list goes on.

In fact, DIY Investor charges .40% management fees and invests primarily in low cost cost index funds (many of which now have zero commissions) which have an expense ratio of approximately .15%. In contrast, many advisors charge 1% management fees and use mutual funds that have expense ratios on the order of 1.3% and, to boot, are actively traded.

What is the impact on fees over the longer term? DIY Investor looked at this using actual market returns over the past 20 years as reported on the BlackRock table of investment performance. This analysis showed that, for a starting portfolio of $1.0 million, the end result was $857,585 less with a 1%/year management fee compared to a 0% (i.e. do-it-yourself investor) where both the manager and the do-it-yourselfer matched market returns. Of course, if you are convinced that your manager can "beat the market" by more than 1%/year then, by all means stay with the manager.

There is another way to look at the impact of fees using the FIRECalc calculator introduced previously. Click "Your Portfolio."  CLICK TO ENLARGE


This will bring you to a page where, at the top, you can input the cost of managing the portfolio in percentage terms: CLICK TO ENLARGE
Source: FIRECalc

There are a number of built-in assumptions for the results (all of which can be changed to reflect an individual's portfolio) that include starting value of portfolio ($750,000), asset allocation (75% stocks/25% bonds), period covered (since 1871), etc.

The results of changing the management fee, starting with a .25% fee and increasing by .25% increments to 1%, are shown in the table in terms of the maximum and minimum values the portfolio will achieve over 30-year periods for the Monte-Carlo analysis:

The results show meaningful swings in the maximum and minimum values over long periods of what many investors take as minor differences in expenses.


No matter how you look at it - portfolio management expenses are expensive over the long run!

Wednesday, May 4, 2011

1:30 am and Running Through the Antietam Battlefield

We have been put in charge of managing our own assets. Instead of company pension plans, we have 401ks. Instead of guaranteed Social Security, there will be changes. Instead of rational markets, there will be times of craziness with bubbles bursting. It's a long race. It's about pacing. It's about some creepy times,  and it's about the joy of completing the journey.

Here's another post with the exact same themes from Lori, my oldest daughter, and her husband Matt:

200 Miles . The American Odyssey Relay Run.

Tuesday, May 3, 2011

Shiller vs. Siegel

Robert Shiller of Yale (author of the well-timed Irrational Exuberance) and Jeremy Siegel of Wharton (author of the prescient Stocks for the Long Run) continue to disagree on the future course of the market. If you follow Shiller, you believe that stocks are at or close to being overvalued. Siegel's view is that stocks offer value at today's prices and now is a time to be bullish.

DIY Investor believes that the appropriate stance is to focus on developing a strong asset allocation plan and sticking with the plan. Still, the views of these two giants in the investment world are worth listening to:

Monday, May 2, 2011

How Long Will Your Money Last?

Running out of money is the number one concern of retirees. The probability of that occurring, and figuring out how much is needed to retire in the first place, has turned into a national past-time with the oncoming so-called "gray tsunami" of retiring baby boomers. At least it has for about 50% of the workforce. Apparently the other half is going to wing it. In any event, there is a neat little calculator for those seeking a ball-park estimate to this question produced by FIRECalc that DIY Investor came across at Free Money Finance.

This calculator starts out very simply and requires a portfolio amount and an assumed spending amount as shown:
Source:FIRECalc
 DIY Investor put in the portfolio amount of $1,000,000 and a spending level of $40,000 to test the 4% rule of thumb. Upon clicking "submit," FIRECalc returns a series of paths graphically. The result is that spending 4% on an inflation-adjusted basis would have been successful, i.e. the retiree would not have run out of money, 94.6% of the time based on 111,  30-year periods .

Just this simple step used in conjunction with expected Social Security, and maybe a possible pension, can start to give a retiree a good idea if his or her nest egg is close to being able to produce the desired income. The FIRECalc tool allows for more sophistication, as well, for those wanting to put in their own assumptions. Just click the tabs on the home page:
CLICK TO ENLARGE 

Sunday, May 1, 2011

What is Monetizing the Debt?

On Friday DIY Investor looked at how the Federal Reserve puts money into the economy. Interestingly, just yesterday he saw a commenter somewhere ask the age old question of where does the Fed get the money to buy securities. The answer is - out of thin air. And this is the problem.

In many areas of life when a screwup occurs there is a choice. People have to pay for their screwup or they are bailed out. Many times it depends on where the screwup happens to be on the economic spectrum. At the lower income part of the spectrum, for example, a job loss can be a catastrophe. Towards the upper end not so much.

One function the Federal Reserve has taken on is bailing out the financial system when it screws up. This of course is the whole "moral hazard" /too big to fail issue.Our biggest financial institutions including investment banks, rating agencies, and even auditors thumb their noses and take excessive risks. They know they'll be bailed out.

The Federal Reserve's  "lender of last resort" function has morphed over time (thanks mostly to former Fed Chairman Greenspan) into a " lender whenever there is a small bump" function.

On Saturday DIY Investor described how the Fed and the Treasury are different. In basic terms Treasury borrows for the Federal government to fund its chronic deficit. Just like any corporation, it issues bonds. To see the actual issuance check out the Bloomberg Calendar where the weekly auctions of bills, notes, and bonds are listed. Treasury borrowing is only a problem in that it "crowds out" private sector borrowing and, in turn, this bcomes an issue as the economy moves towards full employment. It will push up interest rates and thereby worsen the deficit problem.

The real issue is when Treasury borrows and the Fed buys the issues it is selling. This is called "monetizing the debt". The two ballyhooed "Quantitative Easing" programs were basically just old fashioned "monetizing the debt" programs but they couldn't be called that. Certain phrases like "bailout" and "monetizing the debt" are not typically used in polite company.

What does monetizing the debt do? Simply it creates high powered money or what is officially called the monetary base. This is the stuff that bankers hold and use for their part to create money out of thin air. When they create money out of thin air it lowers the value of money. Just like anything, when supply increases, price drops. In terms of the monetary unit this is inflation. When your grandmother said the dollar doesn't buy what it used to it was just her way of saying there has been a lot of inflation.

Now you're probably wondering what the monetary base looks like today. Wonder no more:

The bottom line is this: banks have the potential for explosive growth in the nation's money supply. They have an incentive as well - banks earn profits (and they are profit maximizers like every other business all though that might not be obvious from recent experience) by making loans, i.e.creating money out of thin air.

Chairman Bernanke's press conference was basically to keep markets from freaking out over signs that inflation is picking up. He is attempting to inject confidence in the market as commodity prices skyrocket. He is trying to send a message that the Fed is in control.

All of this is reminiscent of 2006 when he was a leader in the ongoing refrain that the housing crisis was a localized event and wouldn't have a major impact on the broader economy.